Core Python for Image Processing
DAIM Team
Introduction
- Welcome to the second seminar of the DAIM - Images course!
- This seminar will introduce key concepts for image processing in Python.
- This will prepare you for the first workshop of the course.
Learning outcomes
- Recap general uses of image data in clinical settings
- Understand the basics of digital image representation
- Understand what an image transform is
- Understand overviews of two key Python packages (PIL, NumPy)
What is meant by image processing?
- This refers to performing operations on an image to gain information from it or improve its usefulness.
- Digitally, an image is defined as a 2D grid of pixels.
- These pixels contain values - we will go over the types of value that they usually contain
- Remember, concepts that work for 2D images also translate down to 1D and up to 3D (and above!)
- This is important for volumetric scans (CT, MRI)
5-minute open discussion
- How many clinical uses for images can we list?
- Consider 3D images as well as conventional 2D images.
Clinical uses for images
- Radiological applications (plain films, ultrasound)
- Volumetric imaging (MRI, CT)
- Medical photography
- Spectrograms from time-varying signals (e.g. EEG)
Part 1 - How computers represent images
What is a pixel?
- A pixel (picture element) is an element on a grid which can take on different types of values.
- The simplest value that a pixel can take on is an integer value between 0 and 255.
- These are used for shades of greyscale images
A greyscale pixel and the values it can take on, from black to white
Is a greyscale pixel always 0 to 255?
- You will often seen this in floating-point format
- The numbers will be divided by 255 -> 0.0 to 1.0
- They can also be in Houndsfield units (HU)
- We will discuss this in Module 3.
A greyscale pixel with floating point values, from black to white
How about colour representation?
- Pixels each need 3 values (channels) to represent colour
- Red, green, and blue channels (RGB)
- The higher the number, the brighter the colour in the mix
Two different colours with the RGB values needed to generate them
I’ve seen letters when describing colours?
- Numbers can also be represented in hexadecimal (base-16)
- This assigns letters A-F for numbers 10-15
Two different colours with their hexadecimal RGB values
RGB Colour Codes
- Using hexadecimal, colors can be elegantly expressed as strings of 6 letters.
- This is usually preceded by a hash (#)
The same colours with their RGB hex colour codes.
Image dimensions
- The dimensions determine how many pixels are in an image.
- In a colour image, 3 values are needed for each pixel (R, G, and B)
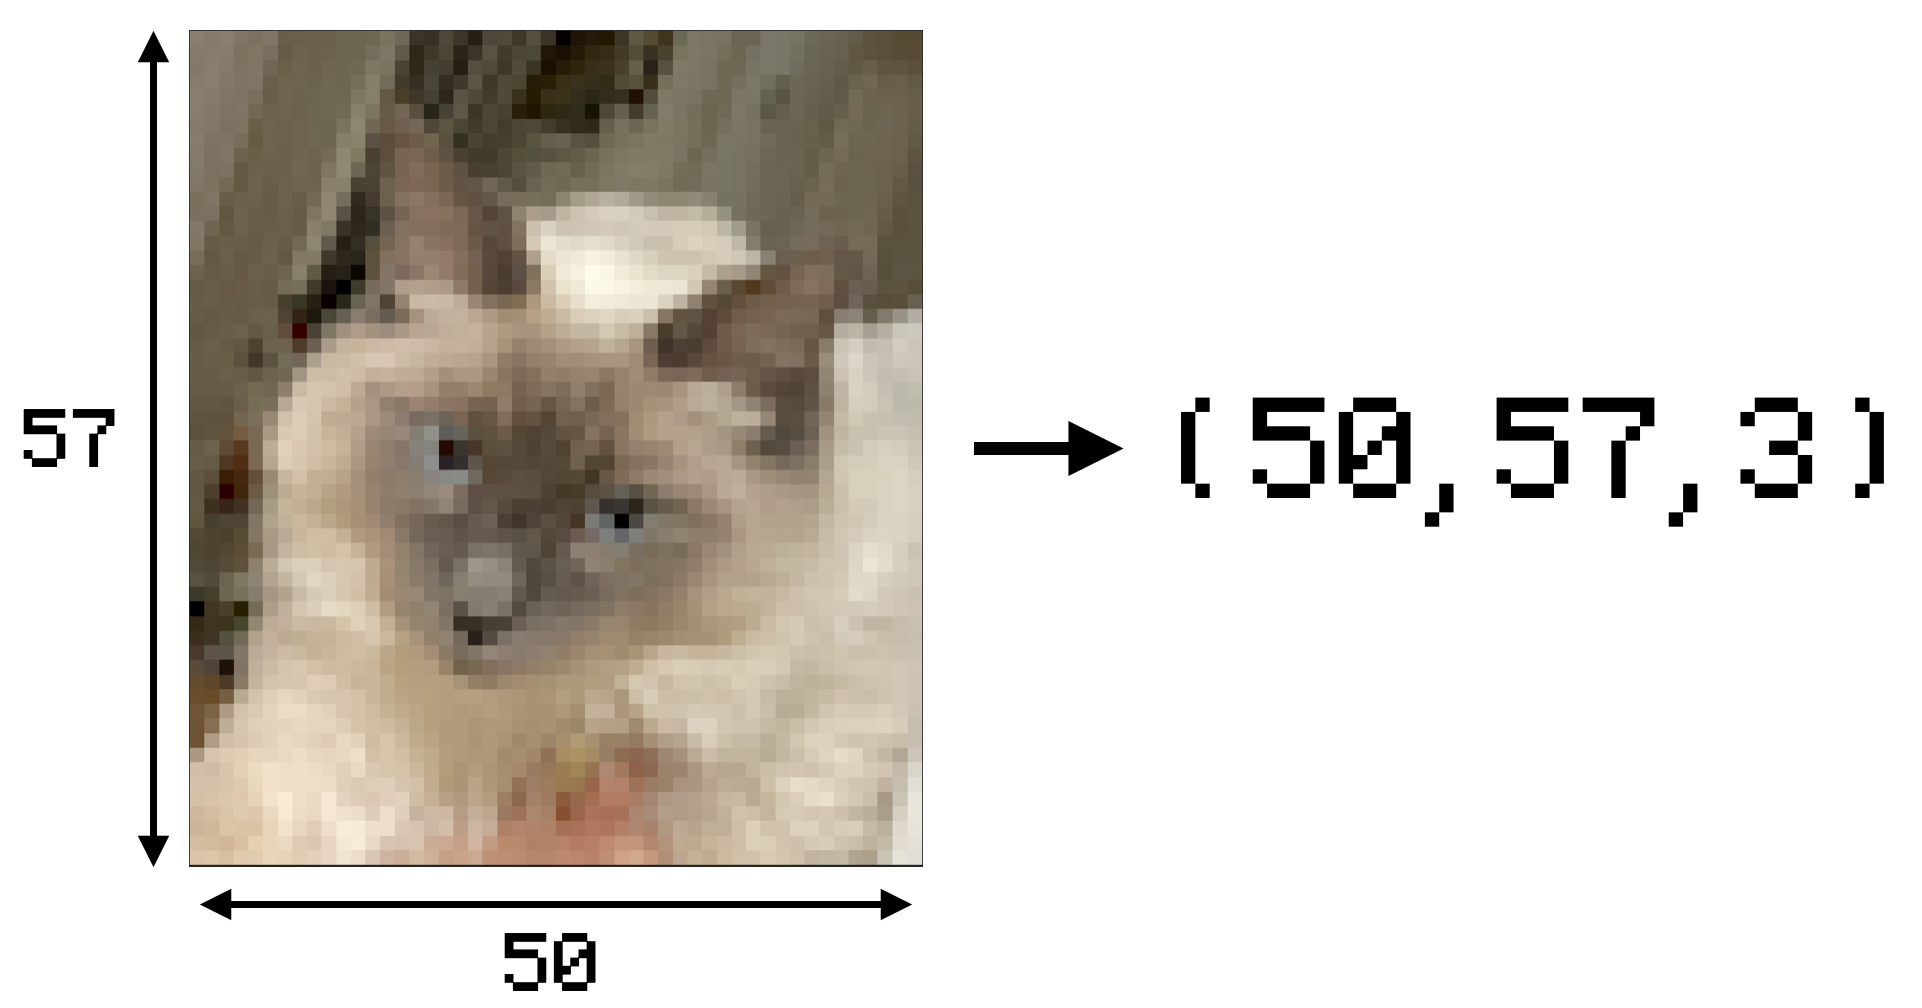
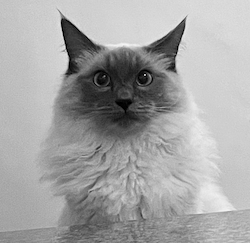
A small image of a cat with the image’s overall shape.
How can we reduce the storage space of an image?
- Compression is the process of reducing image storage requirements
- There are lots of approaches to this process.
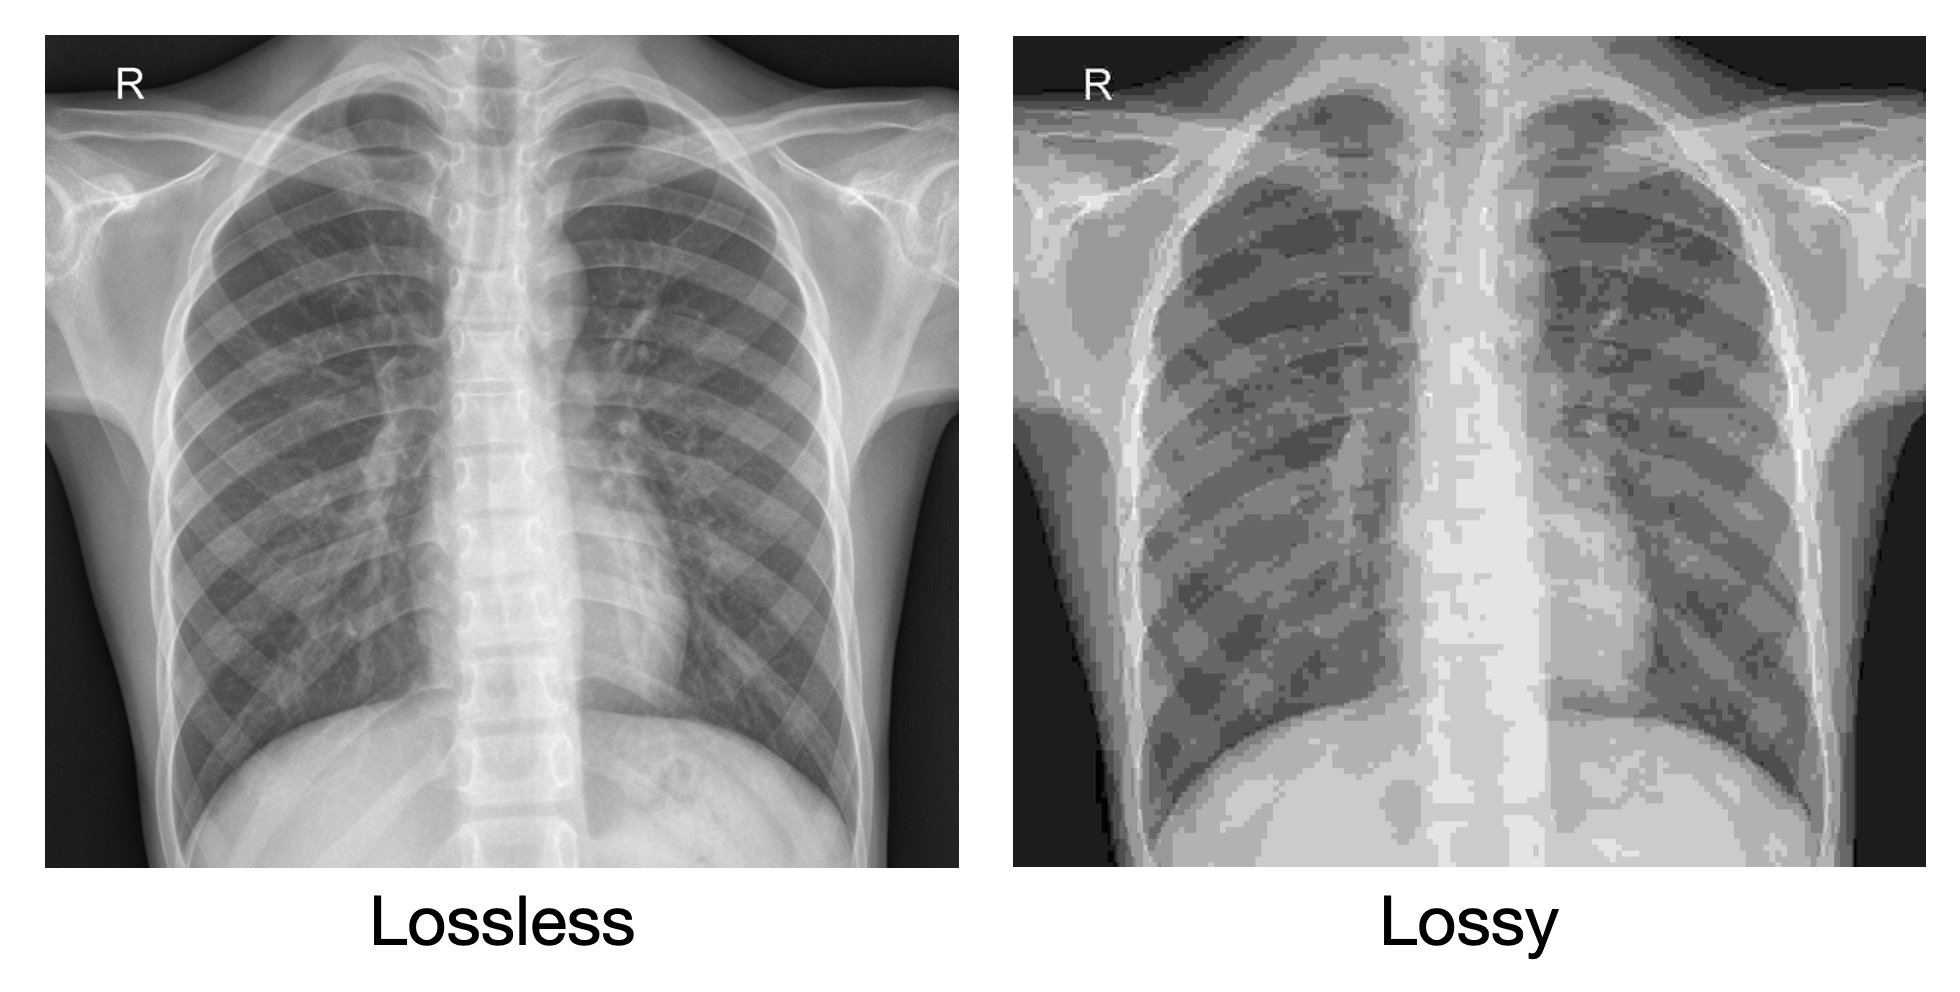
- These methods can be lossy or lossless
Lossy versus lossless compression
- Lossless compression indicates that all the data in the original image can be recovered
- Lossy compression will only produce an approximation of the original image
- This is an important distinction!
Break!
Part 2 - What is convolution?
What is convolution?
- Convolution is a common operation that is used in data processing
- It involves “convolving” a target image with a kernel
- It can be done in 1D (signals), 2D (images), and higher dimensions.
What does it do to an image?
- The change that convolution has on an image depends on a kernel
- Kernels can be designed to produce different effects:
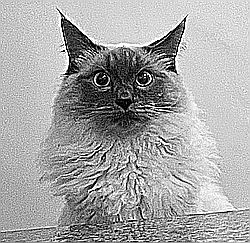
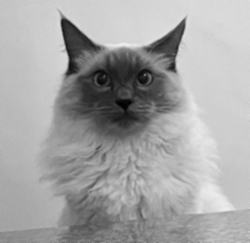
- Blurring, sharpening, edge detection, etc.
What is a kernel?
- A kernel is a small grid of numbers that is used in convolution.
- The structure of the kernel affects the output.
- An averaging kernel is shown below in Python.
Examples of convolution
Why feature convolution in this course?
- Convolution is a key operation in a convolutional neural network, a well-established deep-learning architecture for analysing images
- It is also very versatile and is used in other areas (e.g. signal processing)
5-minute task or break!
- What property do all of the
kernelvariables in the convolution example slide share?
Part 3 - What is PIL?
Python Imaging Library
- Python Imaging Library (PIL) is a commonly used library that contains useful methods for opening and processing images
- The most commonly used part of the package is the
Imagemodule.- Other modules contain methods for doing specific image operations, like filtering and enhancement
Part 4 - What is NumPy?
NumPy
- NumPy is a Python package which is used for doing operations on multidimensional arrays of numbers
- This is how images are represented, and so NumPy contains lots of functions which are useful for manipulating images.
How does array shape work?
- Arrays can be visualised as rectangular shapes of boxes, depicting the array elements
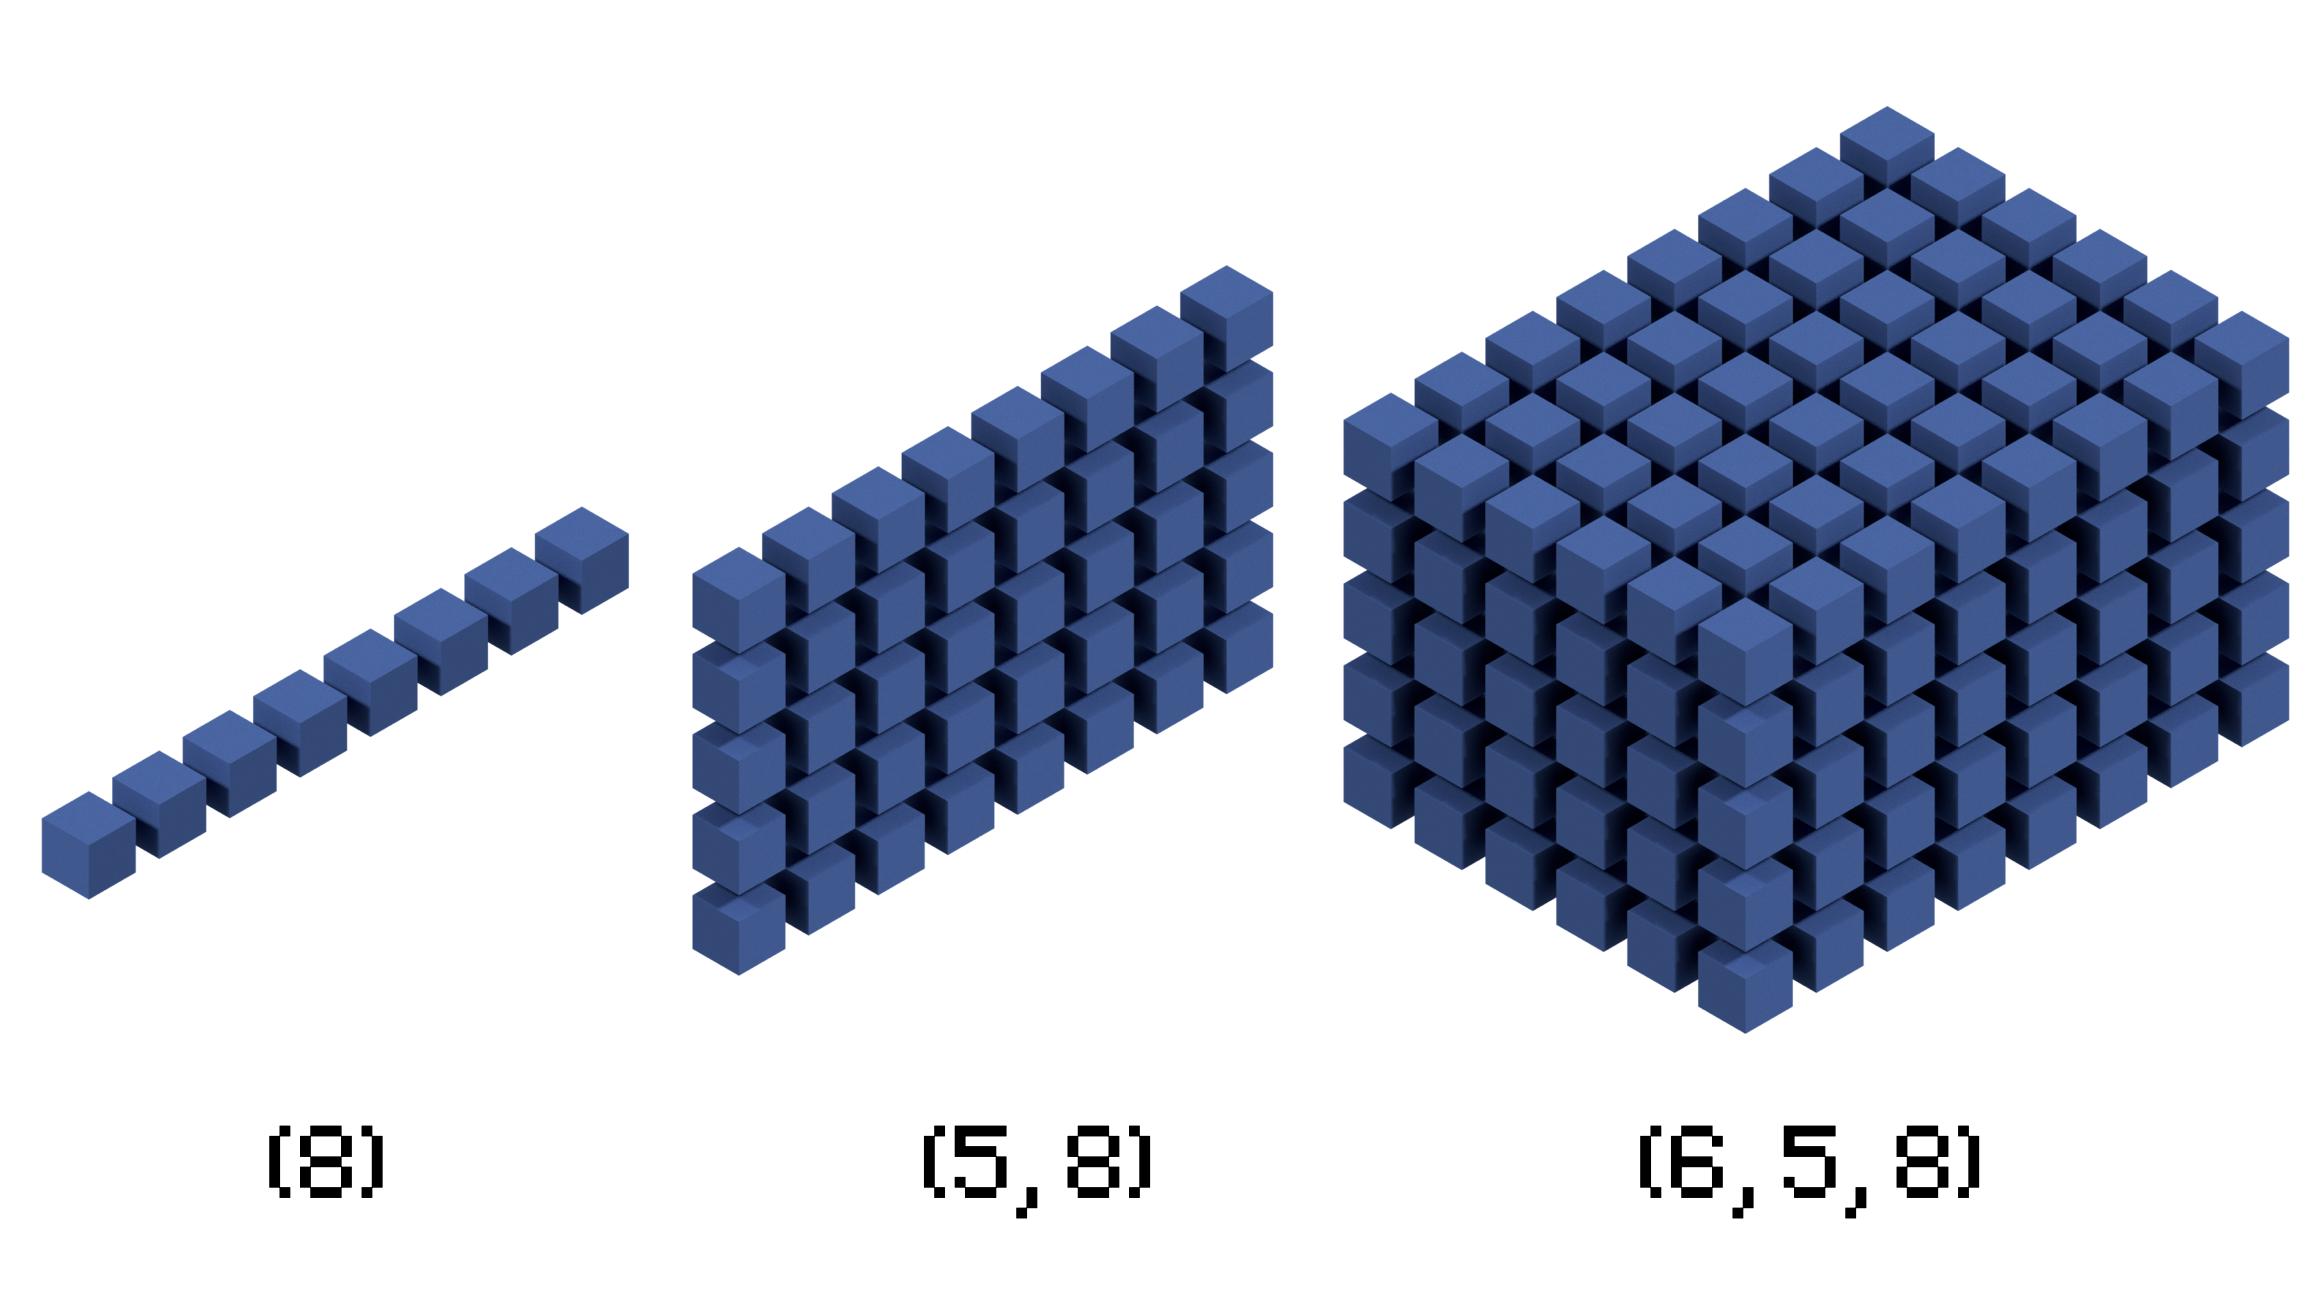
Visualisations of the shape of some example NumPy arrays
Similar shapes
- These shapes are the same, but the dimensions are structured differently, making the data incompatible for some operations
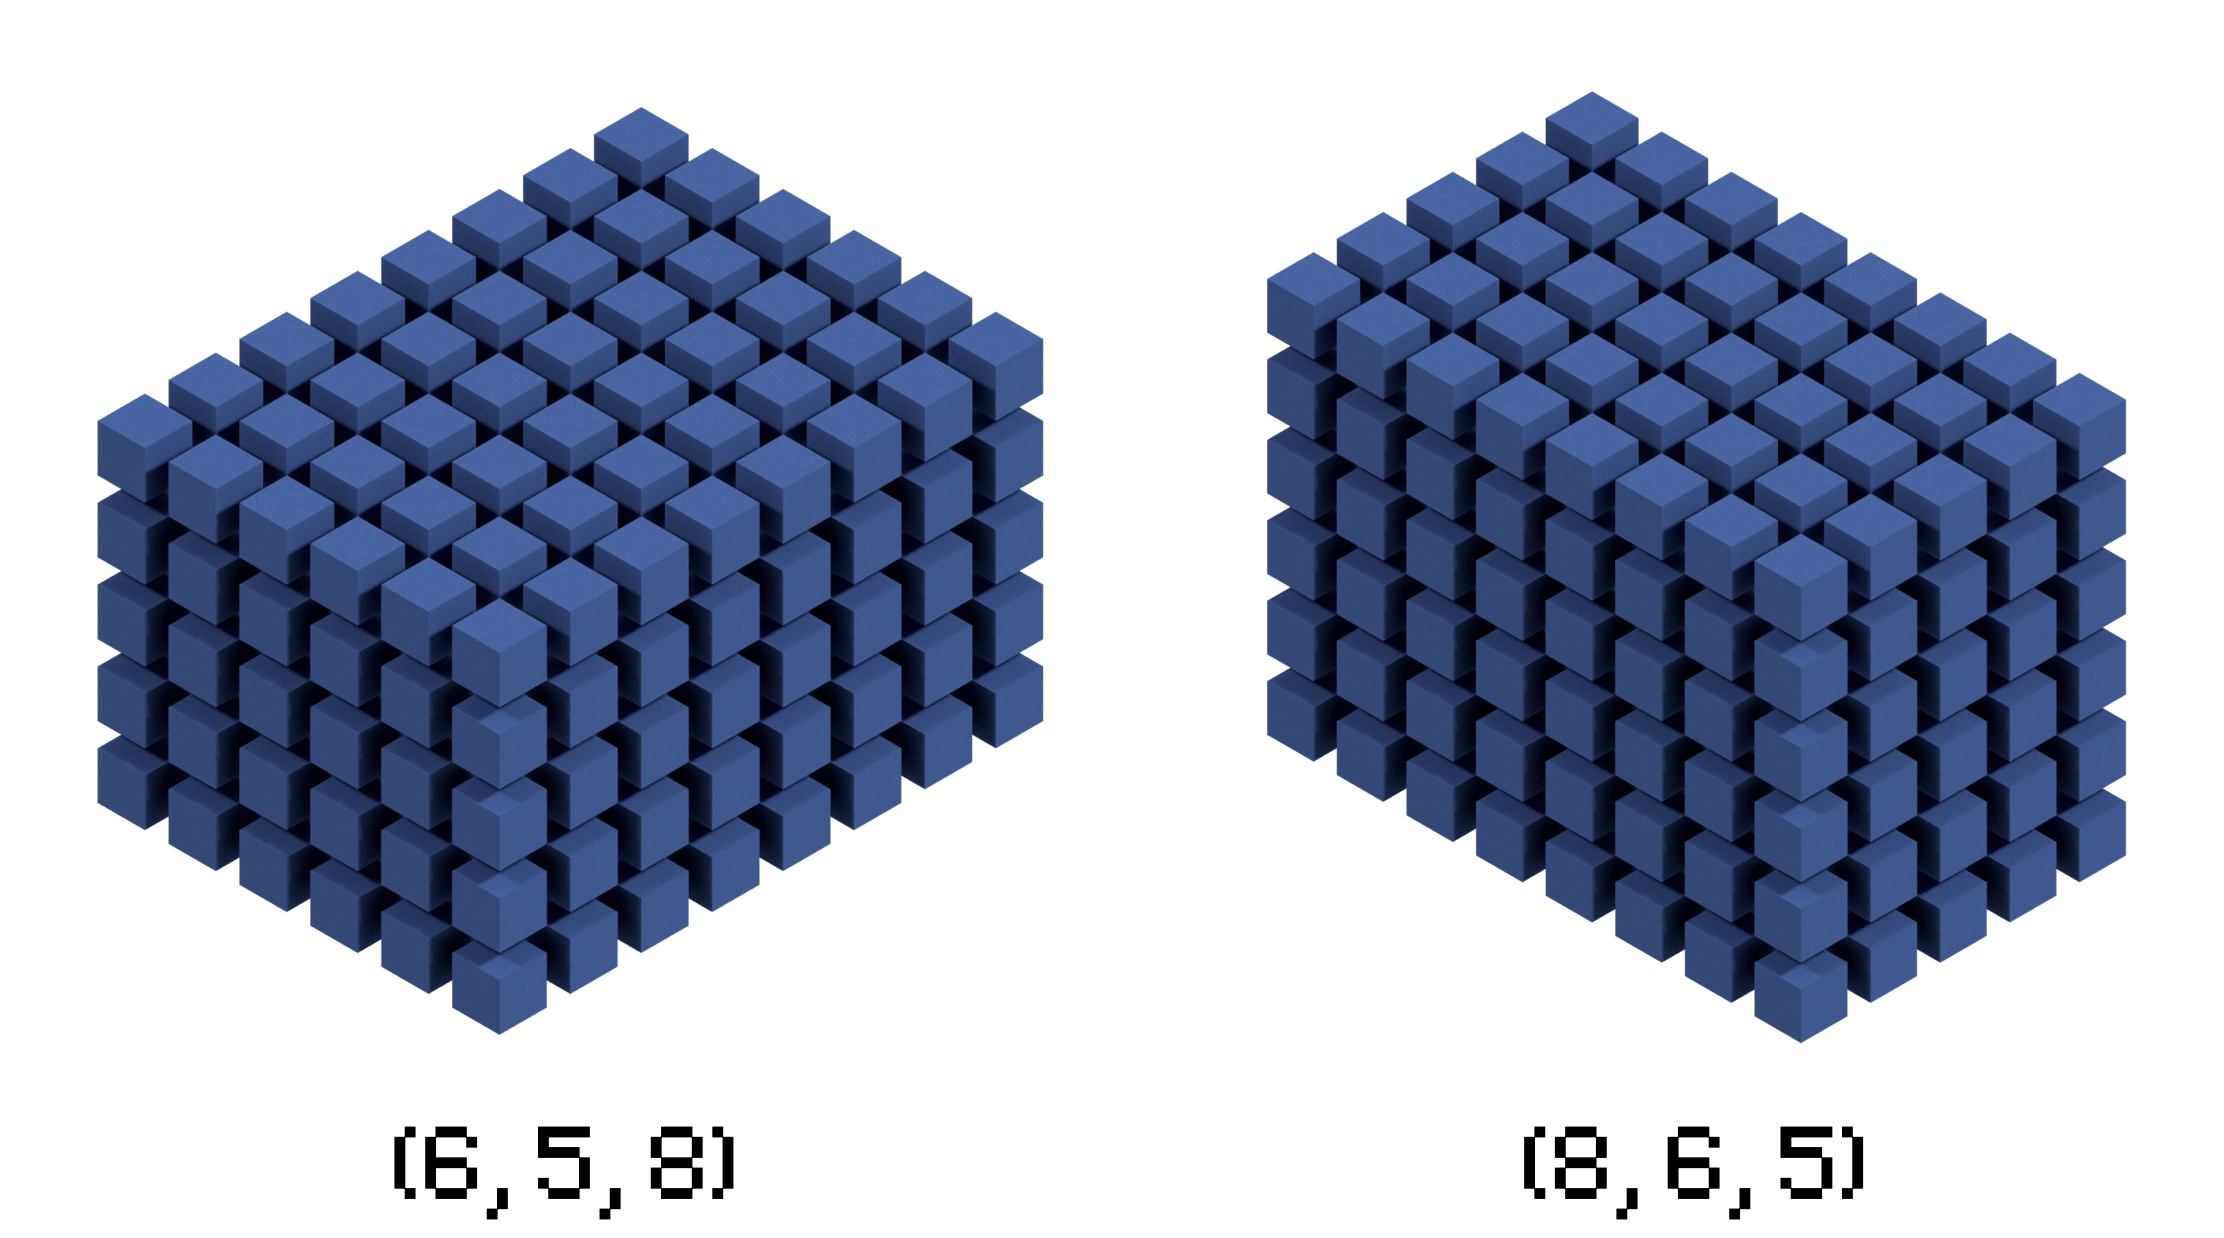
Visualisation of the same data with different dimension structure
How does this relate to images?
- Collections of images are often represented as NumPy arrays
- This is the input data format for many machine learning models
- Data must be preprocessed into this format before training and testing
- The shapes of these arrays can be confusing.
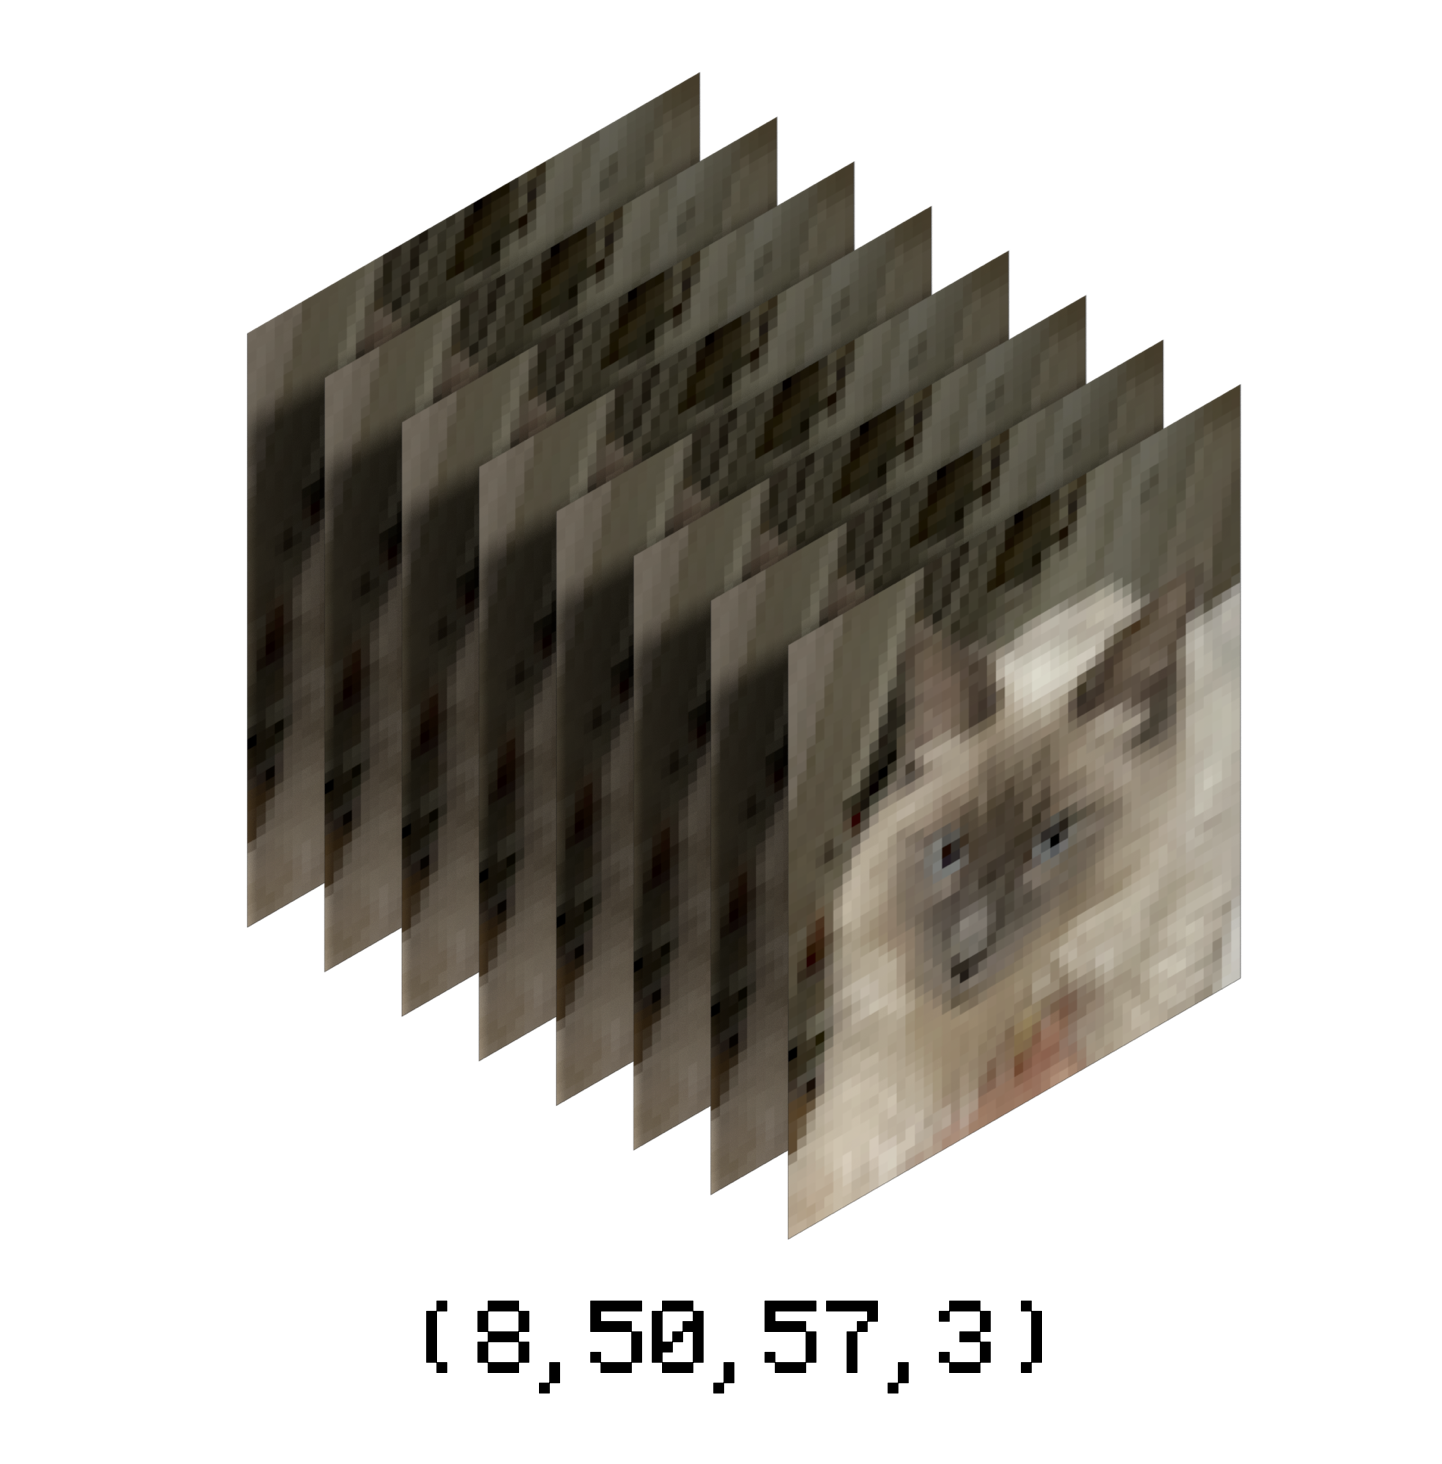
Quiz questions - NumPy Representation
Example 1
Example 2
Example 3
- A DAIM course participant is batching multiple CXR images together for input into a neural network.
- The images are greyscale and have been cropped to a square with a dimension of 256.
- There are 16 images in each batch.
- What is the shape of the final batch array?
Thank you!
Any questions?
