AI: Evaluating an ML Model
Complexity of the Model
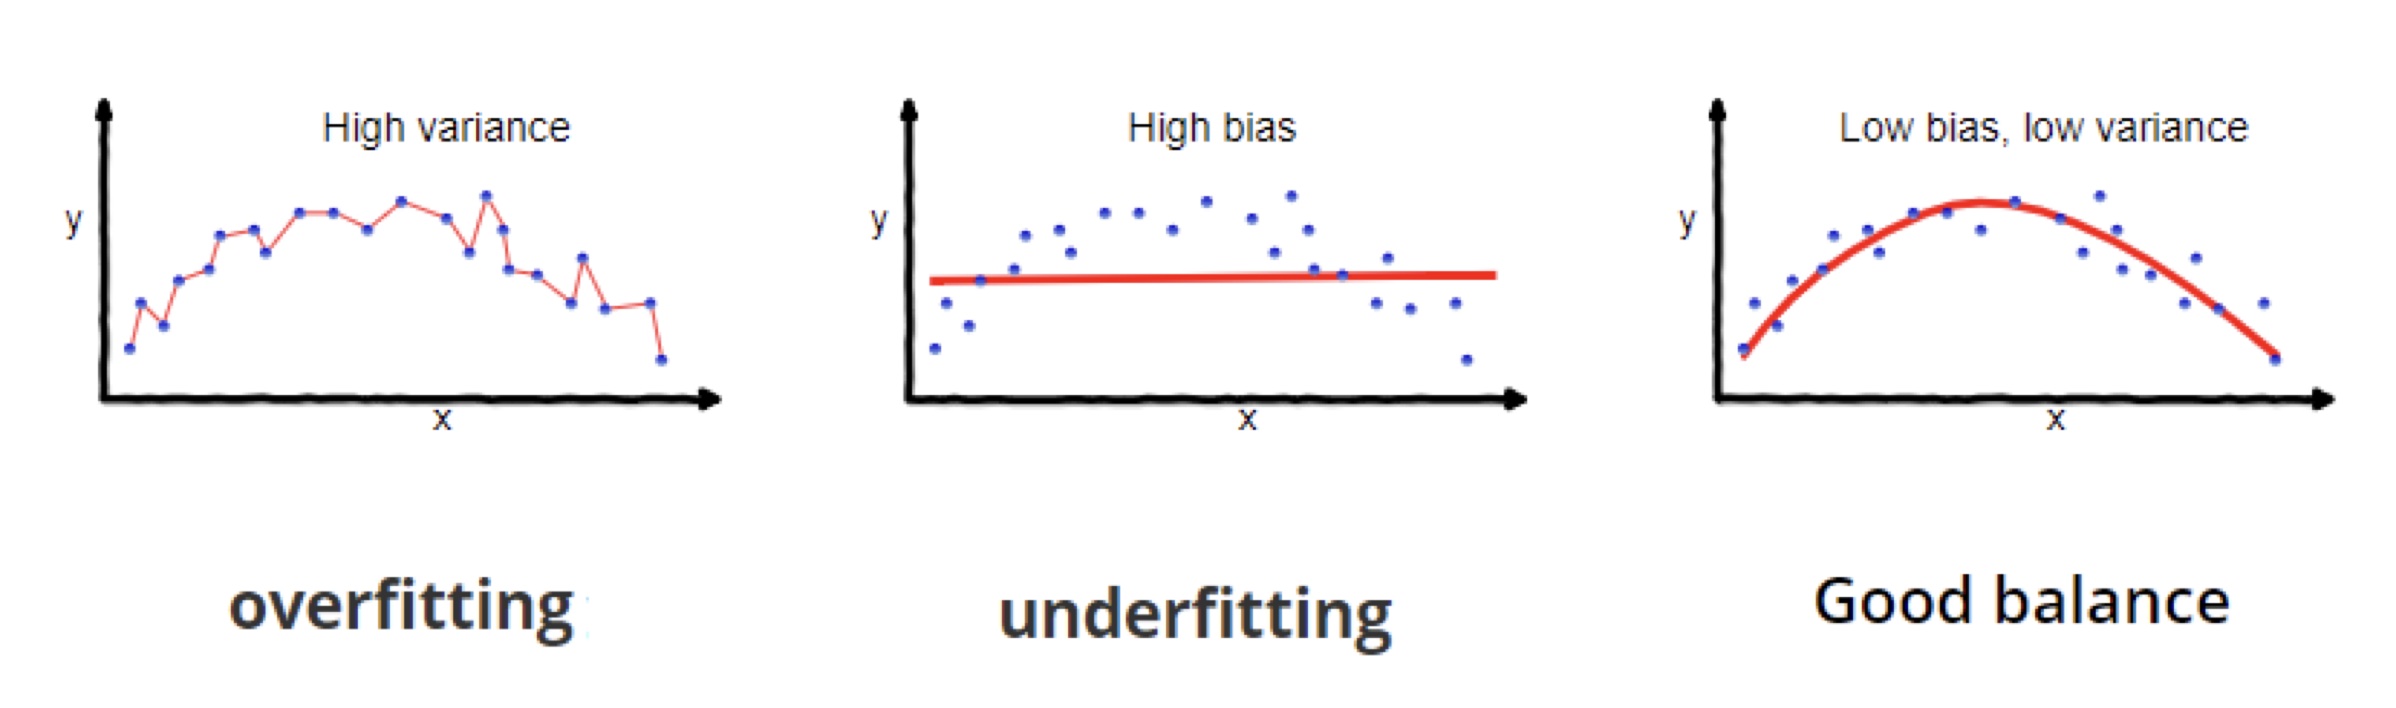
- In ML, you need to trade off between bias and variance:
- Very biased model = assuming everyone is sick
- High variant model = responding to noise
- This describes the difference between overfitting and underfitting
 [Source: [1]]
Overfitting
- The more parameters a model has, the more information it can represent
- However, this can lead to overfitting and inefficiency
[Source: [1]]
Theory: Residuals
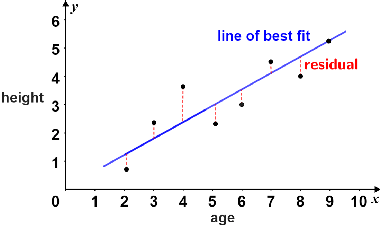
- Difference between true value and predicted value is called a residual.
- Residuals can be positive or negative.
- In this example, the dotted lines are residuals.
 Source: [2]
Theory: Residuals
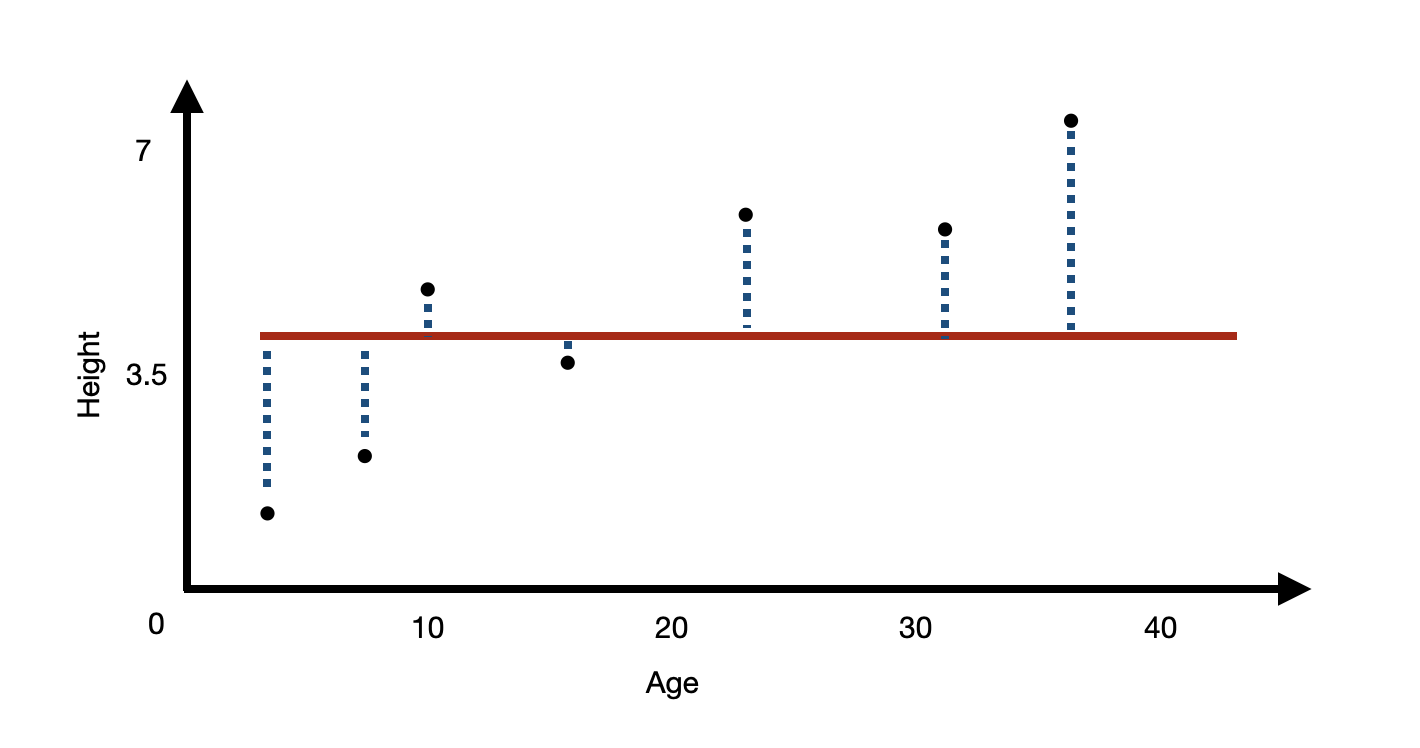
- Intuitively, the worse your model is, the bigger your residuals would be.
- What is the worst model?
[Source [2]]
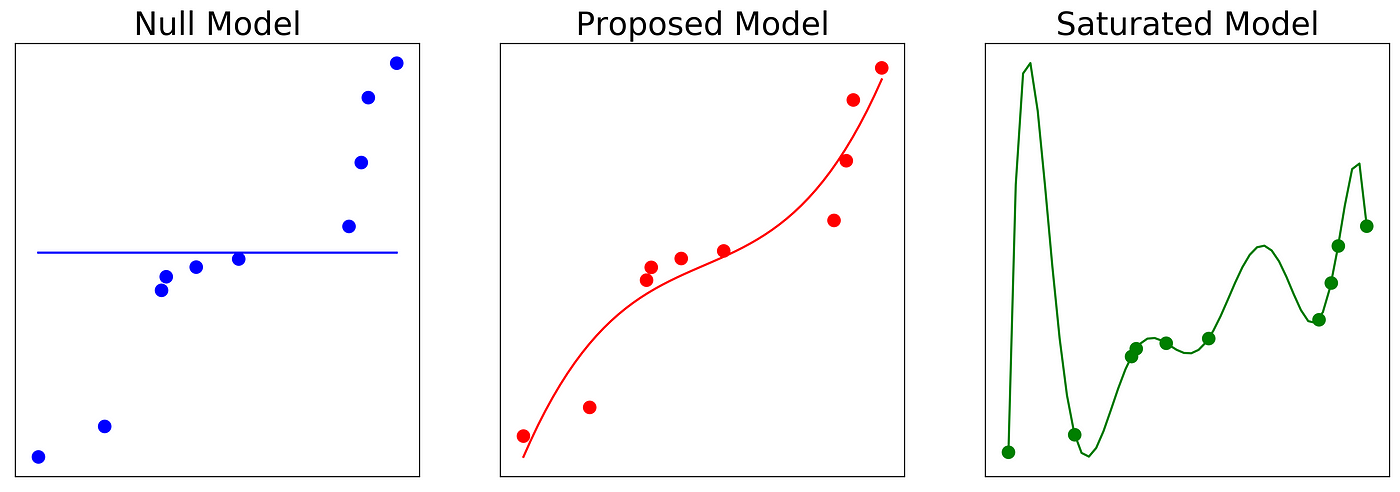
The naive model
- The worst model is your naive model.
- Predicting the mean average at every value will give the largest residuals.
- This is your null model.
Saturated Model
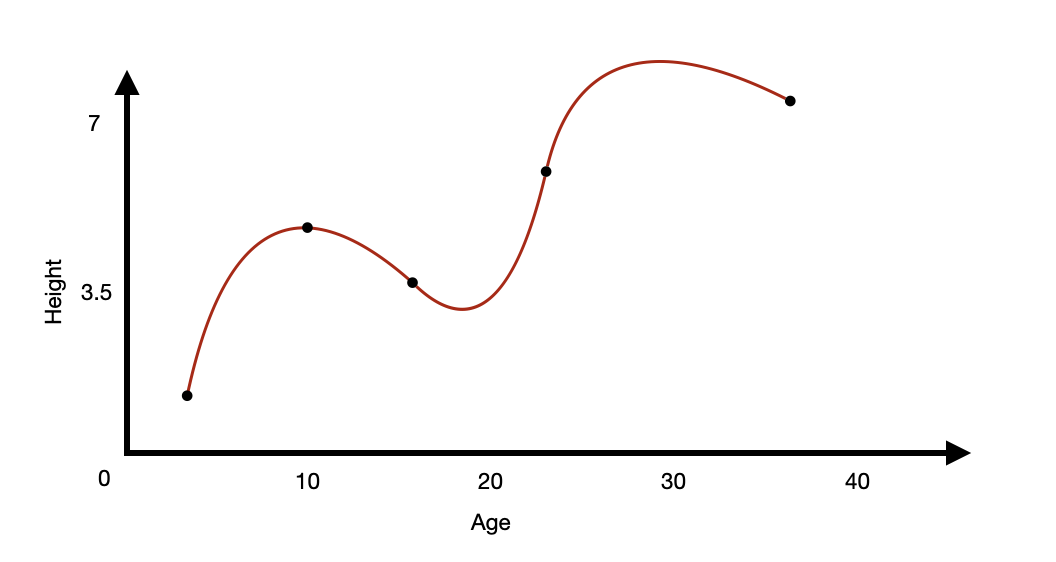
- What is a saturated model?
- A theoretical model where there are as many parameters as data points.
- i.e. You have 5 pairs of measurements for 5 variables.
- If you use all 5, that is a saturated model.
Comparing the models
 [Source: [3]]
Example of AUC curve
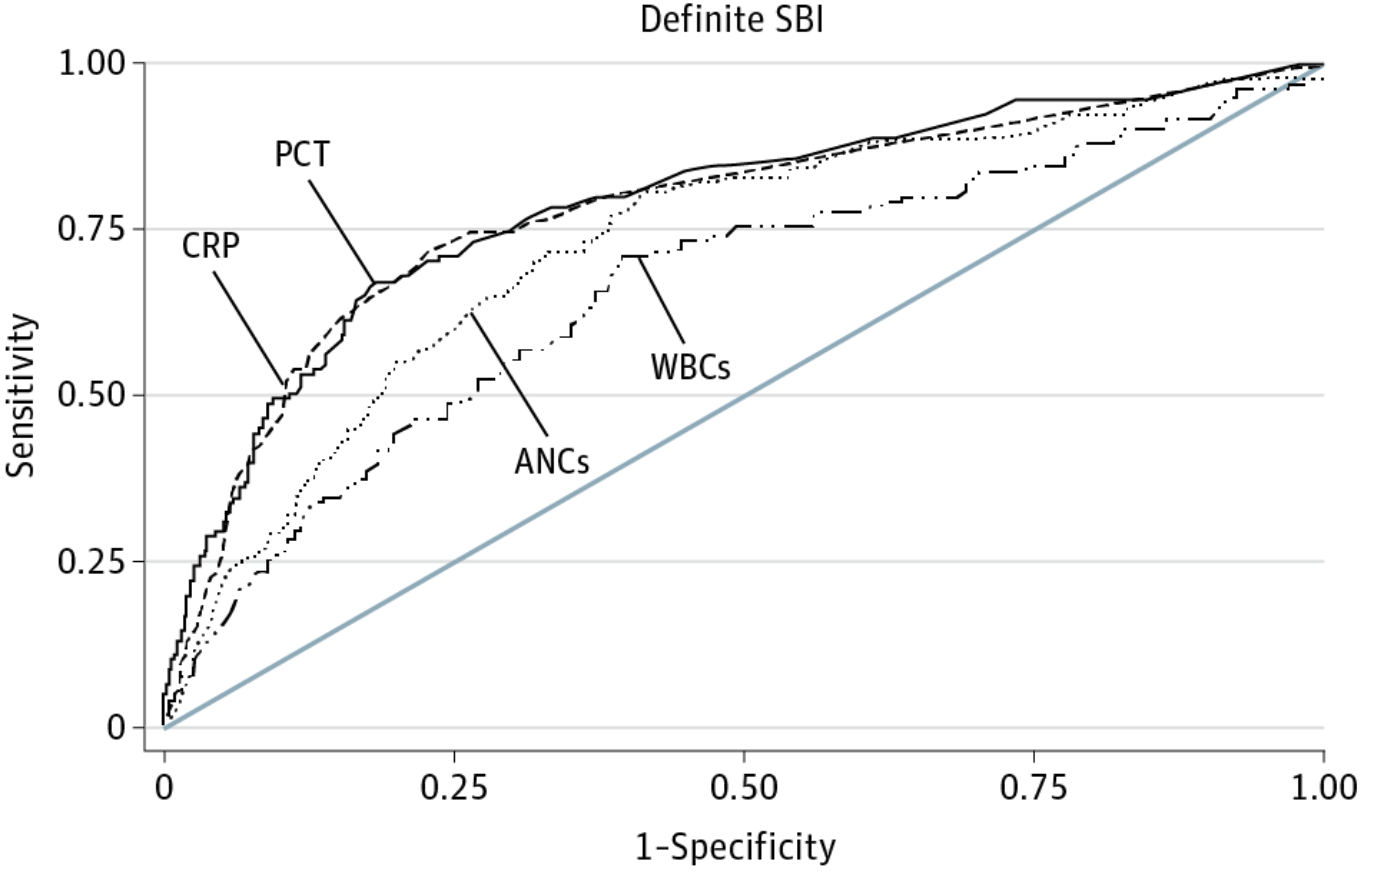
An ROC curve which shows the classification performance for blood different infection markers for predicting serious bacterial infection (SBI) in febrile infants. Milcent K, Faesch S, Gras-Le Guen C, et al. Use of Procalcitonin Assays to Predict Serious Bacterial Infection in Young Febrile Infants. JAMA Pediatr. 2016;170(1):62–69. doi:10.1001/jamapediatrics.2015.3210
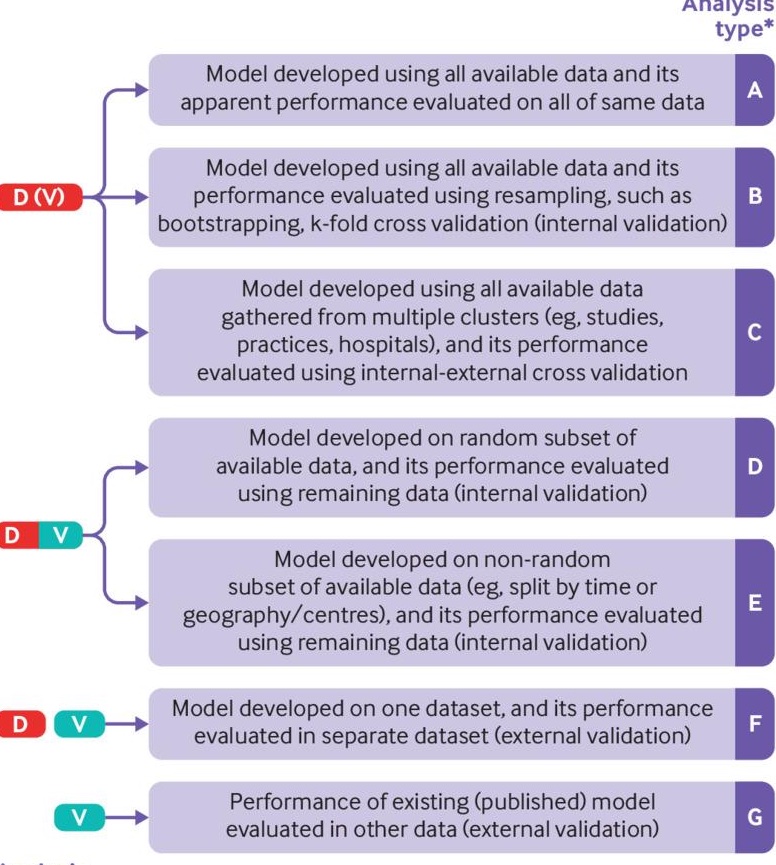
Gold Standards in Medical AI
- Refer to this BMJ article on standards
- Also, see related BMJ content
How Do We Do Good Stop Bad AI?
- Recognize inherent biases and discrimination
- Assume bias is present, then find and address it
- Maximize individual autonomy and privacy
- Reproducibility and transparency are crucial

Even if AI is Good?
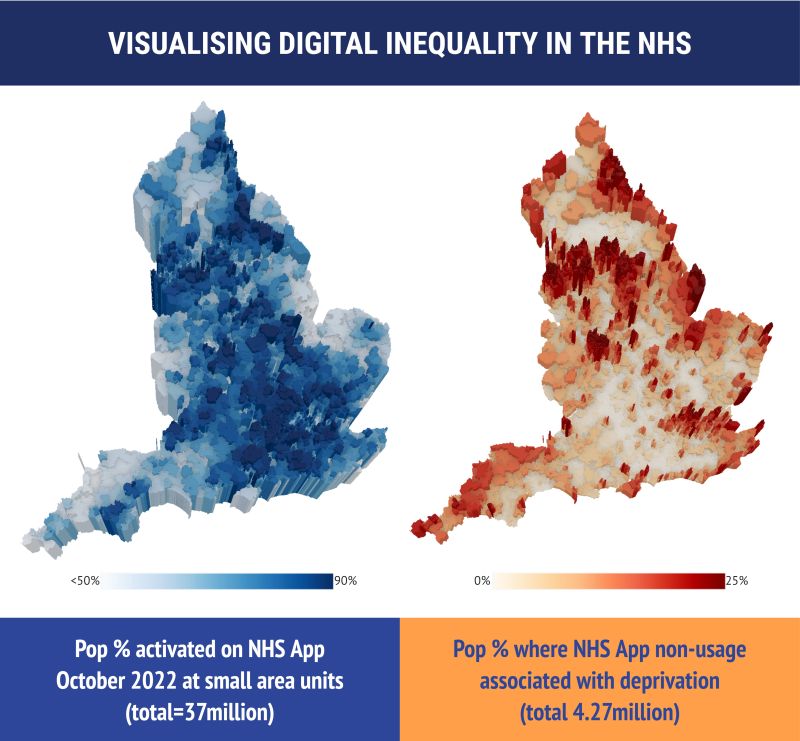
Figure 1
NHS app and deprivation: See this study
Reproducibility: An Analogy

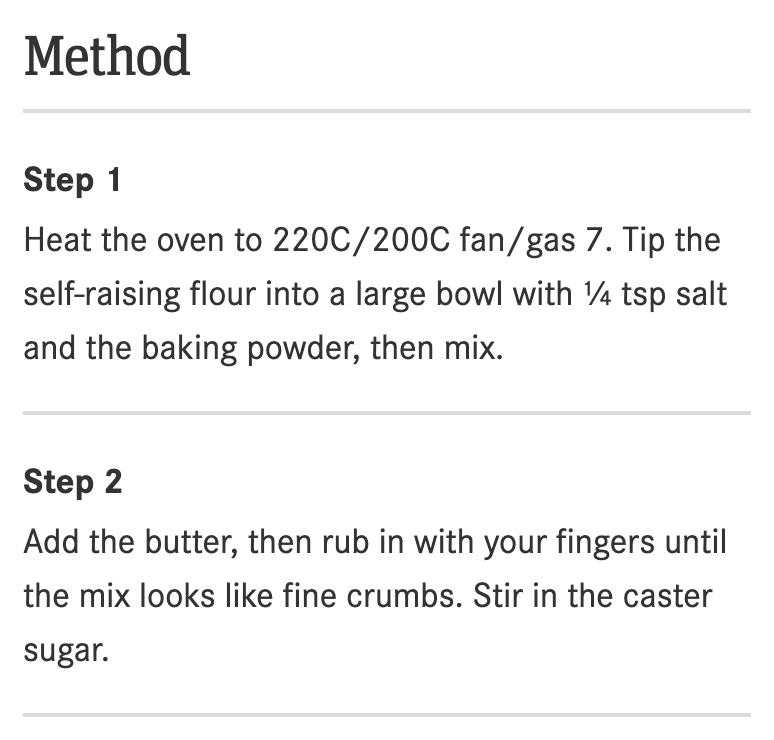
Kitchen and Recipe
Real-Life Example
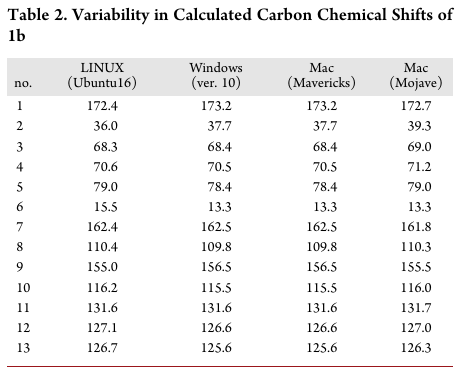
Different operating systems parse data differently Reference: Bhandari Neupane et al., “Characterization of Leptazolines a–d” (2019).
Reproducibility Analogy
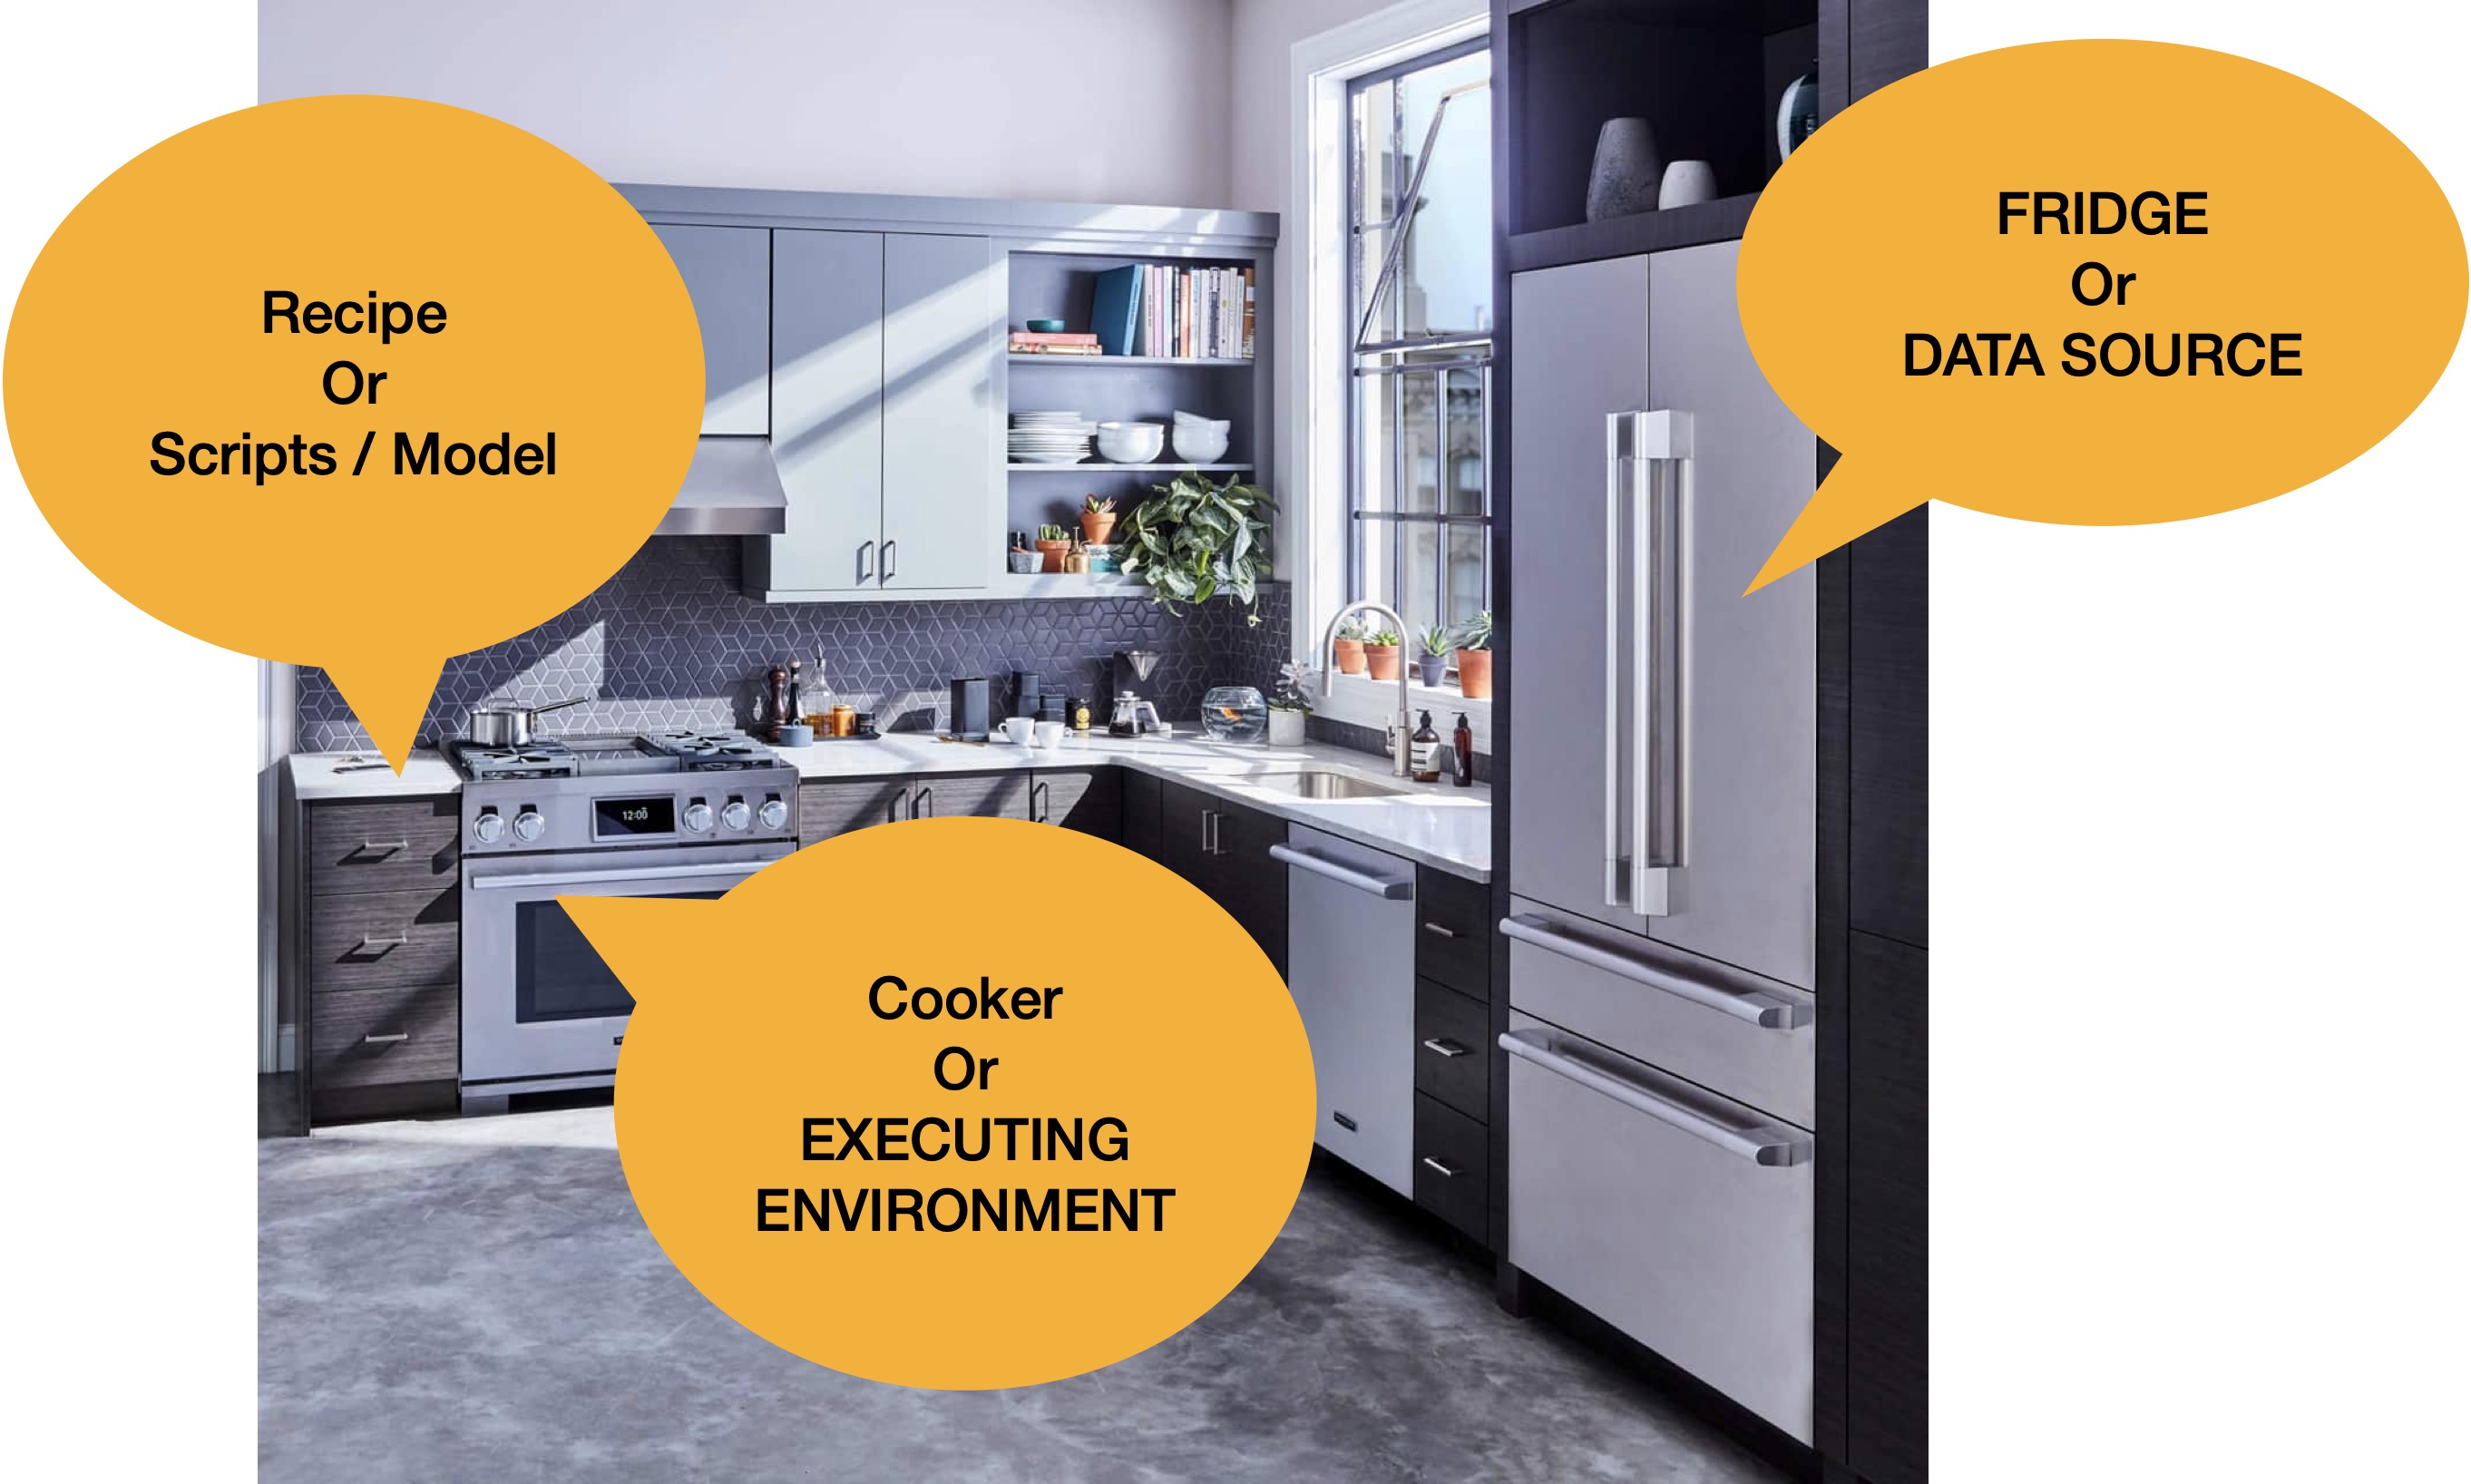 [Source: Kitchen image]